For a visual understanding of the advanced techniques used to study the supermassive black hole SgrA*, see our Media page.
Image reconstruction
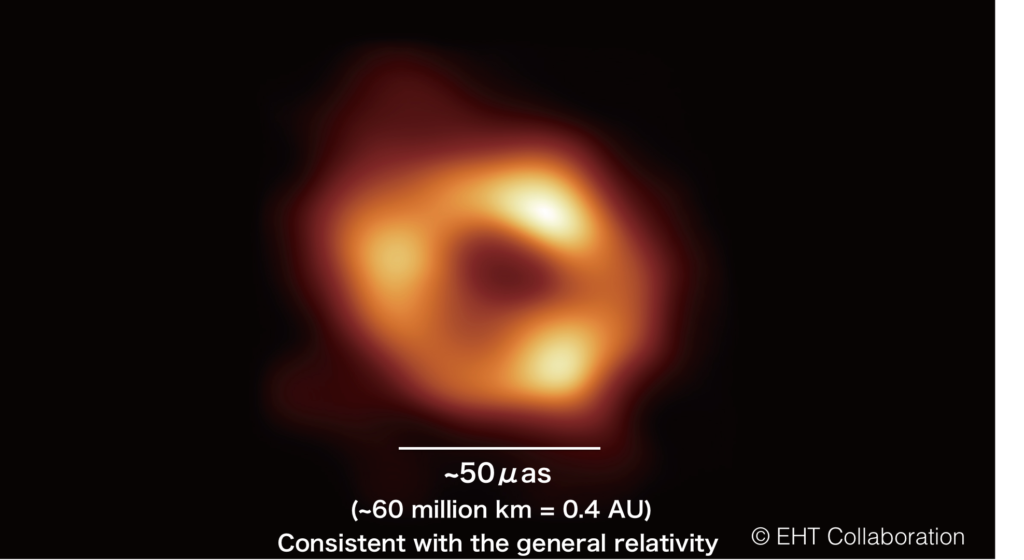
In 2022, the Event Horizon Telescope (EHT) finally resolved the horizon-scale emission of the supermassive black hole Sagittarius A* (Sgr A*) in the Galactic center. This milestone is based on the 2017 EHT observational data with the very long baseline interferometry (VLBI) technique. The EHT virtually constructed the Earth-sized array which enables us to achieve unprecedented spatial resolution (~20 microarcseconds) and captured the black hole silhouette. The representative image (top panel) has a ring-like structure and provides direct evidence of the supermassive black hole in our Galactic center. The image morphology shows remarkable agreement with the theoretical prediction of Einstein’s general relativity and the diameter of the ring (~50 microarcseconds) is consistent with the theoretical prediction.
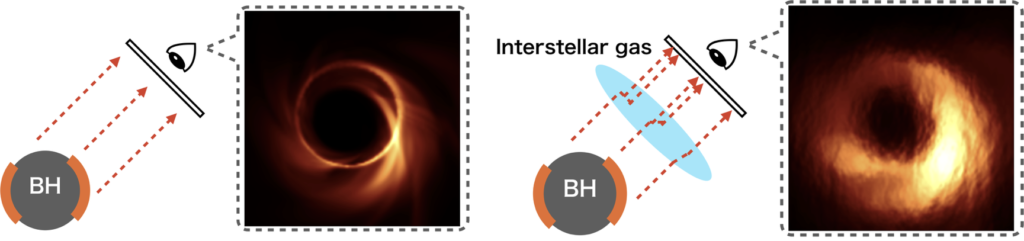
The Sgr A* imaging is more difficult than that of the supermassive black hole M87* in the nearby radio galaxy due to the following challenges. The first one is the interstellar scattering effect. The interstellar plasma located in the region between Sgr A* and Earth blurs the radiation and obscures the image structure (see the upper schematic figure). We estimate the scattering effect with the previous observation at long wavelengths and reduce the obscuring effect from the observational data. We carefully investigate the image morphologies with/without scattering mitigation assumptions and check the fidelity of the obtained images.
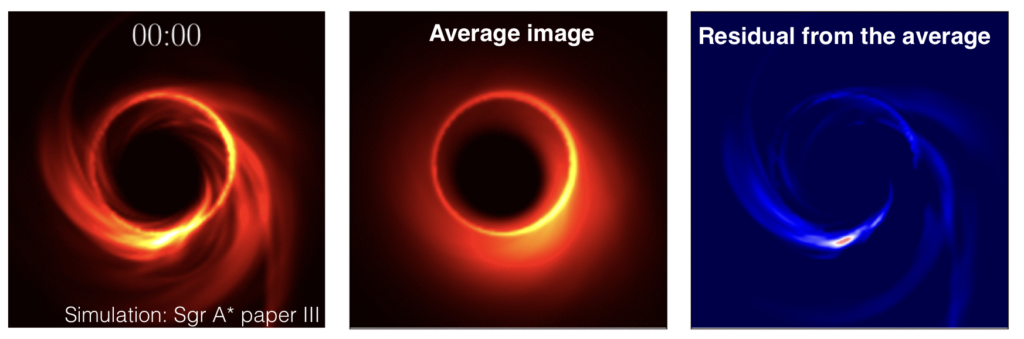
Another effect is the time variability of Sgr A*. Based on the theoretical research and 2017 EHT observational data, it was expected that the plasma around Sgr A* fluctuates with the time scale of a few minutes. While the imaging process with VLBI observation generally assumes that the target source is static during the observational time duration, the Sgr A* variability is much faster than that of EHT observation (~10 hours). Thus the Sgr A* imaging requires a new technique to detect the time-averaged feature from the variable data. We include the Sgr A* variability into the imaging process as the possible uncertainty of image morphologies and construct the method to extract the time-averaged image structures (the demonstration of this idea is shown in the upper panel).
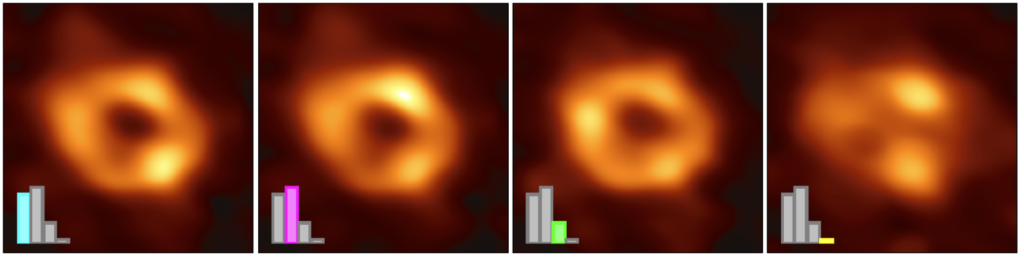
We introduce the new techniques to mitigate the scattering and time variability and investigate the possible image feature with four different imaging pipelines (DIFMAP, eht-imaging, SMILI, and THEMIS). We conducted two million imaging processes and obtained ten thousand ones that can identify whether the Sgr A* image has the ring morphology. All images are clustered into the four representative morphologies (see upper figure): the majority of images are categorized into the first three clusters which have the ring structure with different azimuthal structures. While the minority of images do not have a clear ring feature; the possible origin is the source morphology, non-real features due to the scattering effect, or time variability and sparse EHT data coverage. The extensive imaging surveys with numerical simulations showed that the origin of the non-ring morphology is time variability and sparse data coverage and provided compelling evidence of the ring feature of Sgr A*.
As the main contribution of the Relastro Group at Goethe University Frankfurt, Dr. Kotaro Moriyama made key contributions to almost all sections of the Sgr A* imaging projects as one of the core paper writers and led the imaging surveys as a leader of the SMILI imaging team.
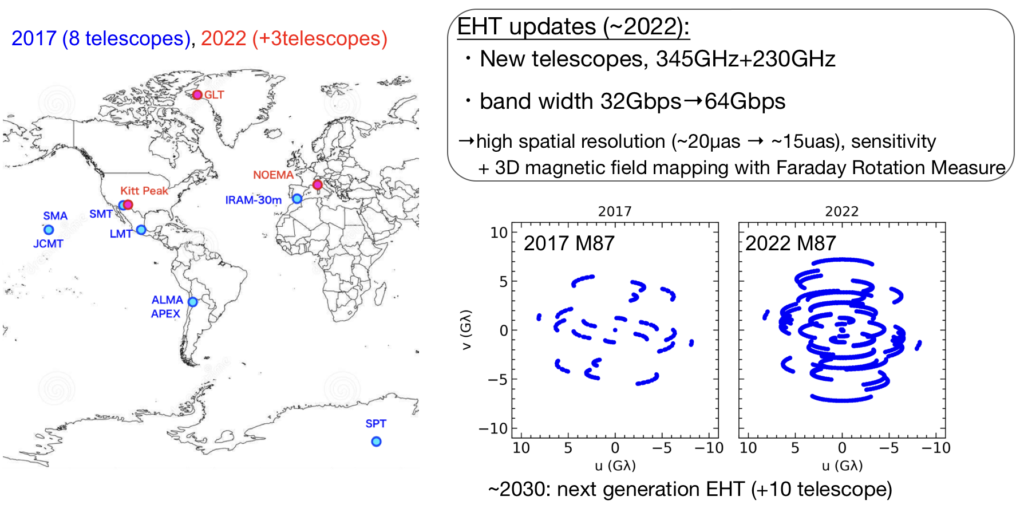
The Sgr A* milestone ushered in a new era for observing the astrophysical phenomena in the strong gravitational field of the black hole. The participation of new telescopes will provide the improvement of the observational sensitivity and angular resolution (upper Figure). In addition, intensive development of video reconstruction and observational updates will provide the opportunity to obtain the first movie of Sgr A* dynamics. The near future observational achievement will provide further theoretical feedback for testing the general relativity, and understanding the growth of the black hole and galaxy evolution.
Insights from numerical simulations
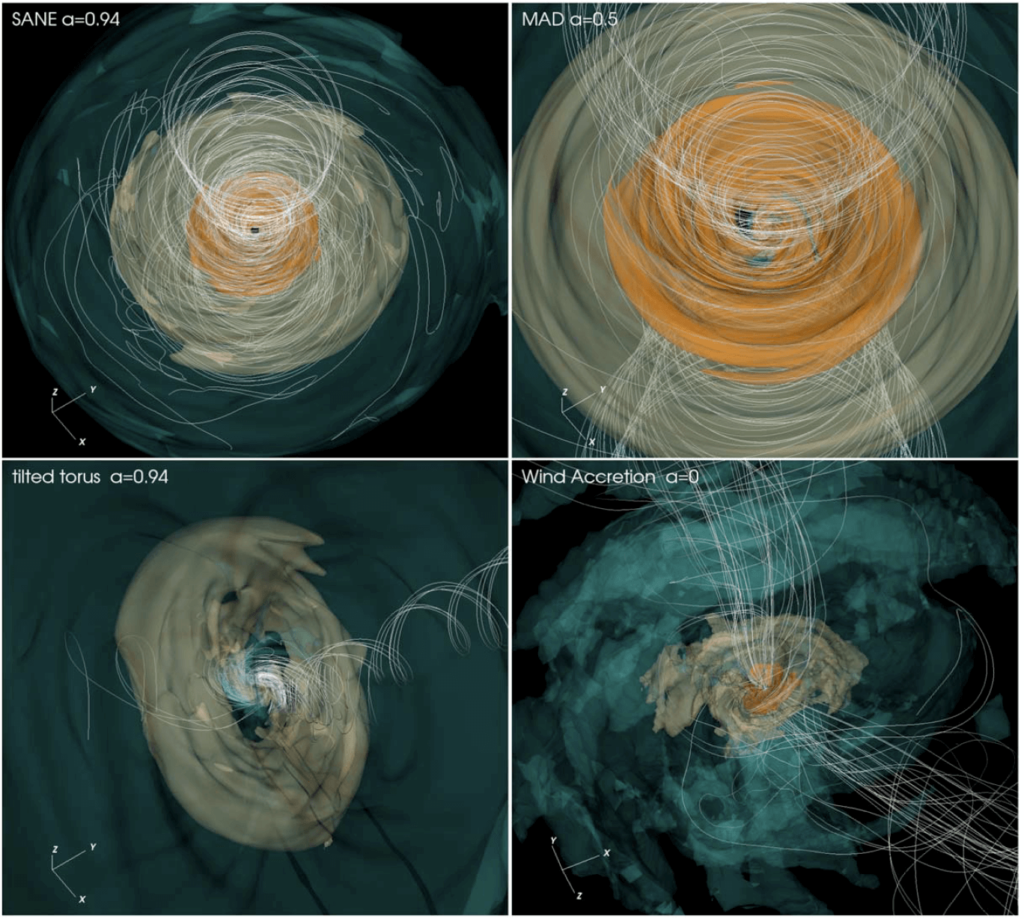
The Relastro group in Frankfurt is one of the main contributor to library of models based on time-dependent general relativistic magneto-hydrodynamics simulations. Our models include aligned, tilted, and stellar-wind-fed simulations; radiative transfer is performed assuming both thermal and nonthermal electron distribution functions. We provided a first physical interpretation for the EHT 2017 observations of Sgr A*. We compared the theoretical image with the resolved EHT data at 230 GHz and unresolved non-EHT observations from radio to X-ray wavelengths. We test the models against 11 constraints drawn from EHT 230 GHz data and observations at 86 GHz, 2.2 μm, and in the X-ray band. We identified a promising cluster of these models, which are magnetically-arrested disks (MAD) and have inclination i=30°. They have accretion rate (5.2–9.5)×10−9 M⊙yr−1, bolometric luminosity (6.8–9.2)×1035 erg s−1, and outflow power (1.3–4.8)×1038 erg s−1 from the black hole.
The 11 observational constraints can be divided into three classes. The first class uses EHT data and compares estimates of source size, morphology of the visibility amplitude (VA) distribution, and three parameters of the best-fit m-ring image model (five constraints). The second class uses non-EHT data, including 86GHz flux density and source size, the median 2.2 μm flux density, and the X-ray luminosity (four constraints). The third class considers variability, including the 230 GHz source integrated variability and the VA variability based on EHT data (two constraints).
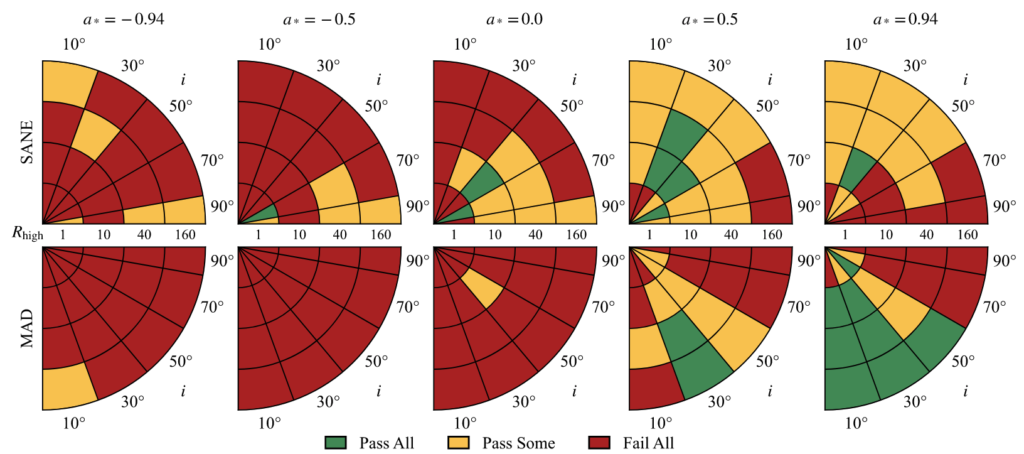
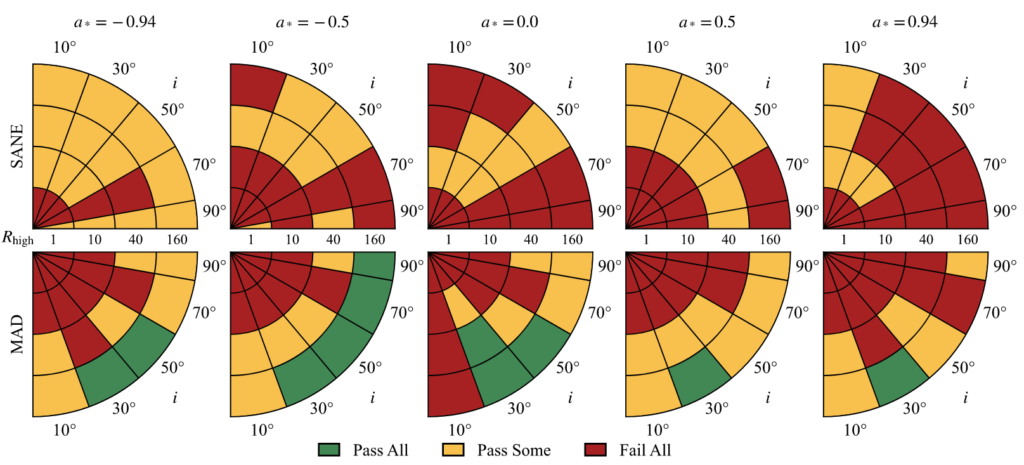
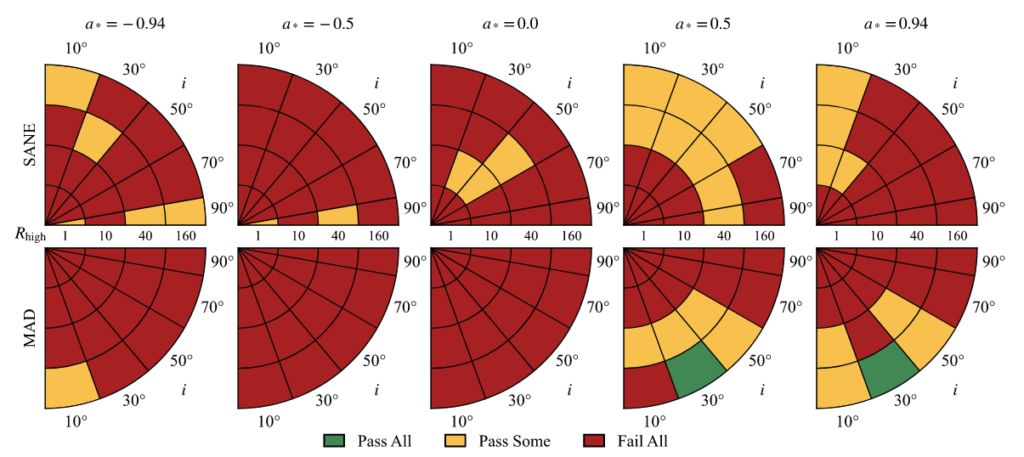
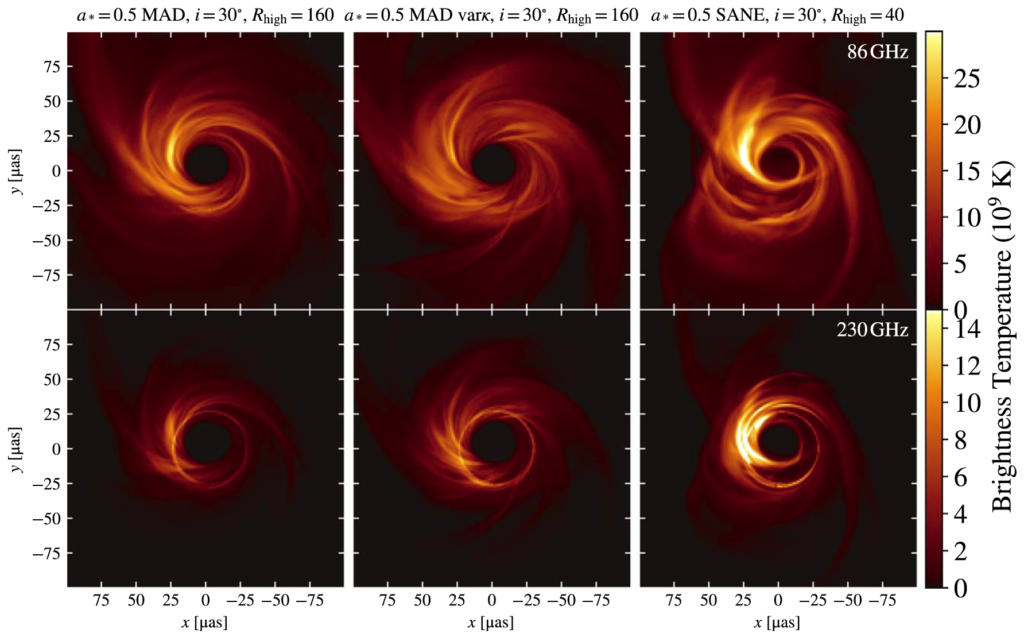
The green region of parameter space in figure above is the best-bet region. The models in this part of parameter space perform well and explain nearly all the data. Given the uncertainty associated with the variability excess and the possibility of missing physical ingredients in the model, the existence of the best-bet region cannot be regarded as evidence that Sgr A* has positive spin and low inclination. Given the large and uncertain set of constraints, however, it is remarkable that any models perform as well as these do. The models in the best-bet region merit additional analysis, and it is interesting to ask what they predict for future observations. The following figure shows the morphology of the best-bet models from relativistic radiative transfer calculations, corresponds to green regions, including different electron distribution function, accretion model and electron temperature
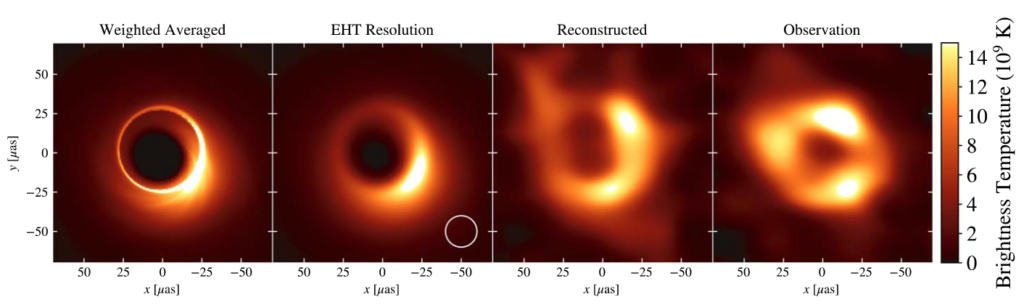
We performed reconstructions of a fiducial model in the best-bet region, compared to the April 7 2017 EHT observations. The leftmost panel shows an average of the snapshots used in the synthetic observation, weighted by the number of baselines at each time. The second panel shows the averaged image convolved with a 20 μas beam, which roughly approximates EHT resolution. The third panel shows an average image reconstructed from synthetic data using the fiducial model. The final image shows the average image reconstructed from April 7 EHT data.
We have performed a first comparison of the EHT 2017 Sgr A* data to a state-of-the-art library of ideal GRMHD models. The models assume that the mass and distance to Sgr A* are known and that the central object is a black hole described by the Kerr metric, i.e., described by Einstein’s general relativity theory of gravity. However, EHT 2017 observations of galactic center is a perfect laboratory to test non-Kerr solution in general relativity and modified theory of gravity.
Tests of the spacetime metric of Sgr A*
All images below are taken from The EHT Collaboration et al. et al 2022 ApJL 930 L17 (“EHT Sgr A* Paper VI”).
The EHT observations of Sgr A* show a bright ring of emission surrounding a brightness depression that we have identified with the black hole shadow. In principle, the diameter of this ring, can be used to measure the properties of the black hole metric and to assess its compatibility with the Kerr solution in general relativity for a black hole of given gravitational radius (or size). In practice, this comparison first requires establishing a quantitative relation (i.e., a calibration factor) between the diameter of a bright ring feature and that of the corresponding shadow. We can then use this relationship, in combination with the measured ring diameter, to infer any potential deviations from the general relativistic predictions.
There are four sources of uncertainty in total that contribute to the error budget in the measurement of the deviation parameter δ. We summarize these as follows:
- The first formal source of uncertainty arises from the measurement of the diameter of the bright ring from the data.
- The second source of uncertainty comes from having to obtain the true diameter of the bright ring. These are consequences of fitting analytic or pixel-based models to EHT data and arise, e.g., from the limited u–v coverage, model complexity, and incomplete prior knowledge of telescope gains.
- The third source of uncertainty comes from obtaining the diameter of the shadow from the true diameter of the bright ring of emission, given a model for the black hole spacetime and emissivity in the surrounding plasma. Since the ratio of the diameter of the shadow to its gravitational radius depends purely on the spacetime geometry, prior knowledge of the latter can be used to measure deviations in the black hole metric.
- Therefore, the final source of uncertainty is in the (prior) measurement of the black hole size from stellar dynamics.
At the end of this process, we obtain the posterior on the fractional deviation parameter δ, which is the fractional difference of the shadow size corresponding to a particular black hole spacetime from the Schwarzschild black hole spacetime value, as shown in the figures below for two different prior black hole size measurements.


As noted above, we can use the bounds on the fractional deviation parameter to obtain constraints on the spacetime metric that can be used to describe Sgr A*. We do this in two ways: (a) by allowing for a number of arbitrary but “reasonable” parametrically-deformed BH metrics and (b) by considering various specific metrics that arise as solutions in different contexts (non-empty spacetimes, non-black hole spacetimes, alternative theories of gravity, etc.).
Parametrically-deformed black hole spacetime metrics
The figure below shows the constraints one can set on a number of deviation parameters coming from three classes of parametrized metrics [Johannsen-Psaltis (JP); Modified Gravity Bumpy Kerr (MGBK); Rezzolla-Zhidenko (RZ)] that describe non-spinning non-Kerr black holes. The white region shows the “allowed” part of the relevant parameter space, i.e., that consistent with the EHT observations of Sgr A*.
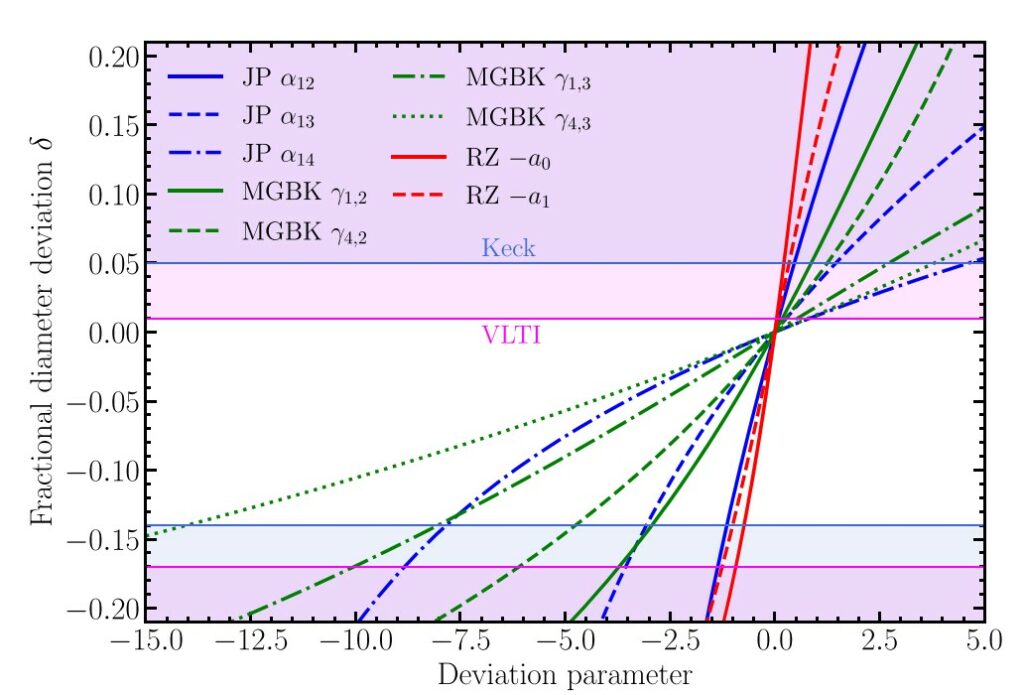
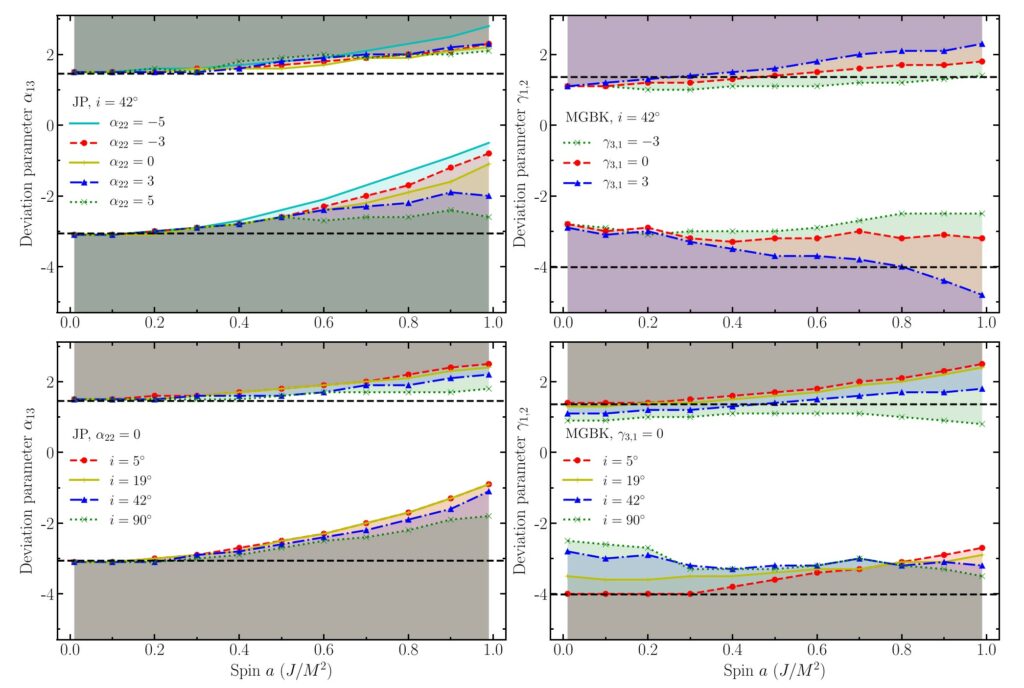
The figure below shows the constraints one can set on a number of deviation parameters coming from two classes of parametrized metrics that describe spinning non-Kerr black holes (i denotes the inclination of the astronomer).
Solution Spacetime Metrics
The figure below shows the constraints one can set on a number of non-spinning (top-left) and spinning (top-right) black hole spacetimes that arise as solutions to either the vacuum or non-vacuum equations of either general relativity or alternative theories. We show also constraints on various non-black hole solutions (bottom-left) that describe naked singularities and wormholes. Finally, we emphasize the constraints that can be set on the black hole parameter space of two types of dilaton-axion theories (bottom-right).


Images of various types of objects
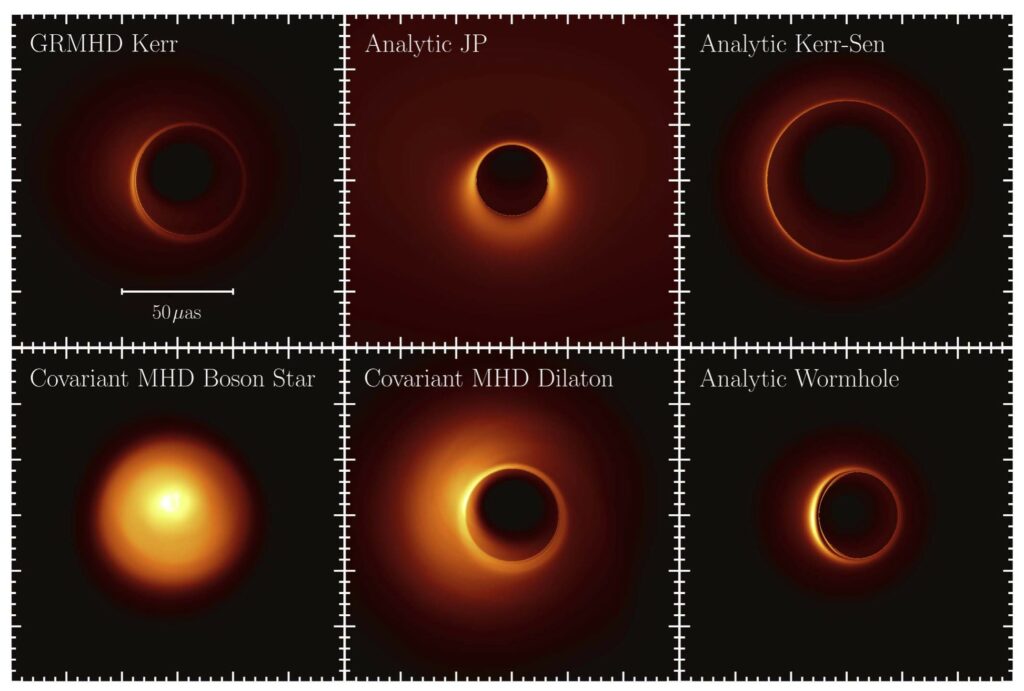
In the figure below, we show a selection of simulated 1.3 mm Sgr A* images for different spacetime geometries and plasma models. From left to right, the top row presents time-averaged images of a realistic (general relativistic magneto-hydrodynamics or GRMHD) simulation of accretion flow onto a Kerr black hole and of semi-analytic accretion flows when the background spacetime given by the JP metric and the Kerr–Sen spacetime instead. The bottom row presents images from realistic simulations of accretion onto a boson star, a dilaton black hole, and also a semi-analytic accretion flow in a traversable wormhole spacetime.
In the figure below, we compare a fiducial synthetic image of hot accretion flow around a Schwarzschild black hole (top row) with corresponding images when the central object has a reflecting surface at a radius 2.5 times the gravitational radius (to compare, the Schwarzschild event horizon is at 2 times the gravitational radius). For the case of an object with a reflecting surface, we vary the surface albedo across rows (parameter A).
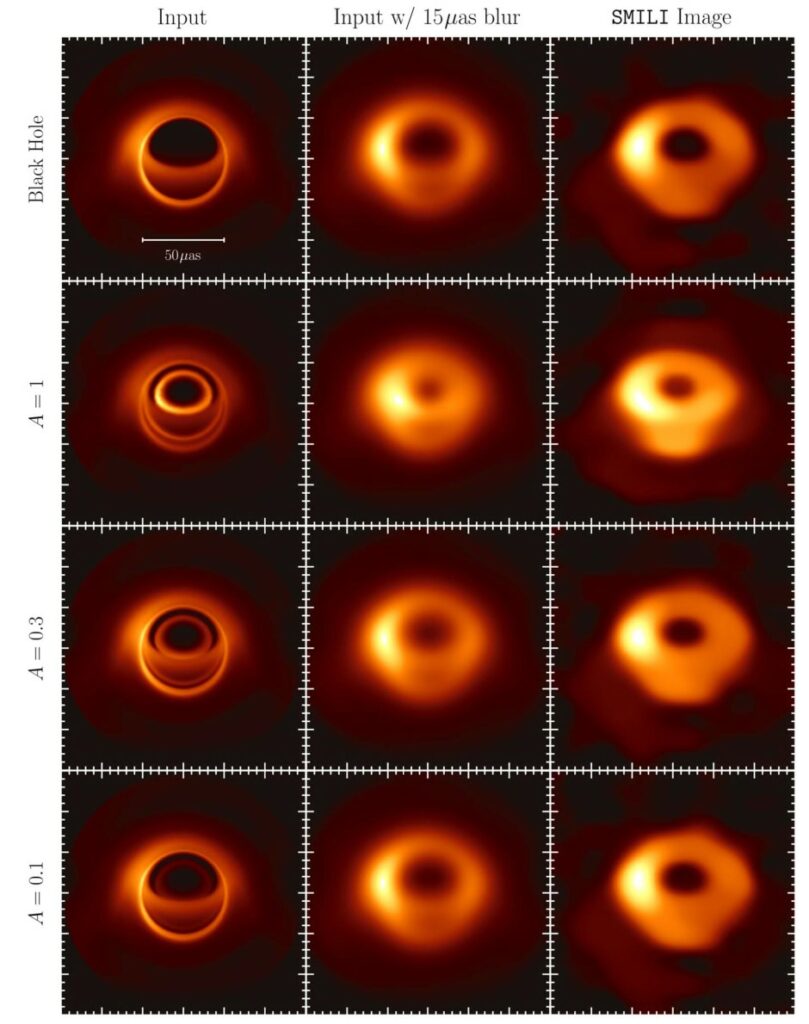
The structure, size, and persistent nature of the black hole image lead us to identify the central brightness depression with the shadow that the black hole is expected to cast on the emission from the accreting plasma. Using the depth and size of this brightness depression, as well as the observed broadband spectrum of the source, we rule out the possibility either that Sgr A* has a surface that fully absorbs and remits thermally the incoming energy flux or that it has a reflecting surface at 1.3 mm with significant albedo.
We find that the Kerr predictions are consistent with observations at the ∼10% uncertainty level. We then use this strong-field inference to place bounds of order unity to the parameters of metrics that deviate from Kerr. The ~4 million solar-mass of Sgr A* places these tests of the Kerr metric in a region of the parameter space of gravitational objects that has never been probed before in the strong-field regime. This mass is approximately 5 orders of magnitude larger than the masses of the objects probed by LIGO/Virgo via the detection of gravitational waves and a factor of 1500 smaller than the mass of the black hole in M87. Leveraging the fact that similar bounds on the strong-field predictions of general relativity have been placed by gravitational-wave and imaging observations across this 8-order-of-magnitude range in mass, we conclude that it is unlikely for the fundamental theory of gravity to possess a scale in this range.